Görsel soru 1
Görsel soru 1
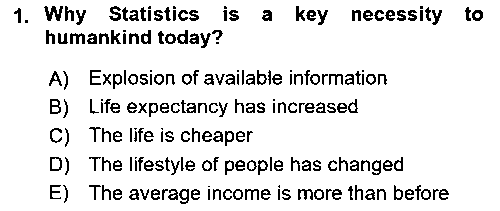 Görseli tam boyutta aç ↗
Görseldeki doğru seçeneğin harfini işaretle.
Sonraki görselli soru ↓Soru arşivi yükleniyor…
Sorular yükleniyor…
Sınav ve konu sorularıyla çalış. Cevabını kontrol et, zorlandığın soruları kaydet ve yeniden çöz.
73 sorunun metninde arama yapabilirsin.
Diğer 3 görselli soruları kendi sayfalarında çözebilirsin.
Soruyu oku ve A–E arasından cevabını seç. Seçiminden sonra doğru cevap gösterilir.
İlerleme yükleniyor…
Görseli tam boyutta aç ↗Görseldeki doğru seçeneğin harfini işaretle.
Sonraki görselli soru ↓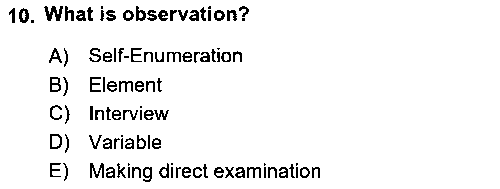 Görseli tam boyutta aç ↗
Görseldeki doğru seçeneğin harfini işaretle.
Sonraki görselli soru ↓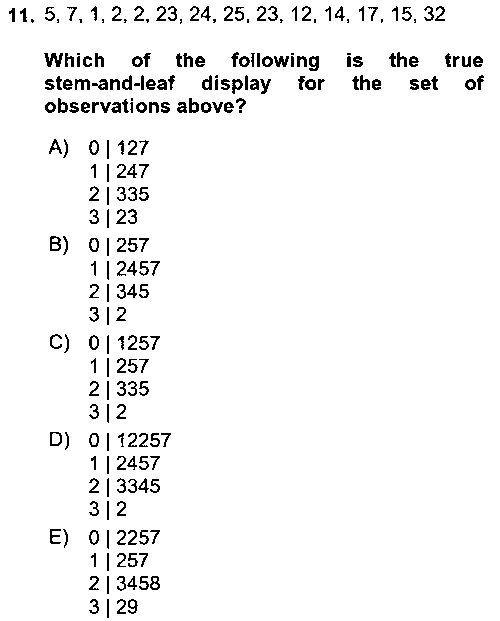 Görseli tam boyutta aç ↗
Görseldeki doğru seçeneğin harfini işaretle.
Kendi cevabını düşün, sonra yayımlanmış cevapla karşılaştır. Değerlendirmeyi sen yaparsın.
İlerleme yükleniyor…
The outcome about a single variable for an element in the data set is called an observation.
Cevabın yayımlanmış cevapla uyuştu mu?
The assignment of numerals has two basic rules: 1. Numerals are labels that have no inherent meaning, for example zip codes, automobile license plates, or student identification number. 2. Numerals are numbers that have quantitative meaning and can be analyzed, for example, age, height, weight or weekly wage of a worker.
Cevabın yayımlanmış cevapla uyuştu mu?
Error in measurement can be described as any discrepancy between the actual result obtained and the correct result that would be provided by an ideal procedure. From a statistical point of view any observation is composed of the true value plus some random error value. However, all error is not random. The error component of any observation can be divided into two subcomponents, random error and systematic error.
Cevabın yayımlanmış cevapla uyuştu mu?
Elements are the entities on which the data are collected.
Cevabın yayımlanmış cevapla uyuştu mu?
The outcomes obtained on all variables for one element in the data set is called a case.
Cevabın yayımlanmış cevapla uyuştu mu?
Test scores would be dependent as they are the ones that cannot be labelled or the ones that are wanted to be examined.
Cevabın yayımlanmış cevapla uyuştu mu?
Random errors are caused by unknown and unpredictable factors that randomly affect measurement of the variable across the sample. Random error does not have any consistent effects across the entire sample. Instead, it affects observed scores up or down randomly. Random error adds variability to the data and it is sometimes called noise.
Cevabın yayımlanmış cevapla uyuştu mu?
Open-ended questions allow individuals to give a free-form answer. However, closed-ended questions can be answered with “Yes” or “No,” or they have a limited set of possible answers such as “A”, “B”, “C”, or “all of them”.
Cevabın yayımlanmış cevapla uyuştu mu?
To construct a frequency distribution table, the measurement categories and the number of responses within a given measurement category are used.
Cevabın yayımlanmış cevapla uyuştu mu?
A variable is a characteristic of interest about an element. A characteristic that can take on different possible outcomes is called a variable.
Cevabın yayımlanmış cevapla uyuştu mu?
The variable is defined as quantitative if the outcomes are numbers.
Cevabın yayımlanmış cevapla uyuştu mu?
It would require a single response since the question has the word favourite in it.
Cevabın yayımlanmış cevapla uyuştu mu?
The variable is defined as qualitative if the outcomes are nonnumeric qualities or attributes.
Cevabın yayımlanmış cevapla uyuştu mu?
Once a questionnaire has been developed, it is important to determine whether respondents are interpreting questions as intended and whether the order of questions may influence responses. For this purpose, a pretest is conducted using small sample of the survey population. Pretesting finds out the unpredictable difficulties in the layout of the questionnaire and in the clarity of wording. Hence, the problems determined in the pretesting can then be corrected before the research is begun.
Cevabın yayımlanmış cevapla uyuştu mu?
Error in population specification as seniors are not the only students at a university. There are also freshmen, sophomore, and junior students.
Cevabın yayımlanmış cevapla uyuştu mu?
Systematic errors are reproducible inaccuracies that shift measurements from their true value by the same amount and consistently in the same direction. This type error arises from problematic, poor calibrated or incorrectly used equipment.
Cevabın yayımlanmış cevapla uyuştu mu?
When the data set is large or the measurements are obtained using ratio scale, grouped frequency is more appropriate for summarizing the data.
Cevabın yayımlanmış cevapla uyuştu mu?
Four different scales for measurement have been identified. These are nominal, ordinal, interval and ratio scales.
Cevabın yayımlanmış cevapla uyuştu mu?
Interval scale because interval scales of measurement have the properties of classifying, magnitude, and equal intervals. While the ordinal scales of measurement show that individuals have more or less something than the others, interval scales have more precise information indicating how much of something individuals have.
Cevabın yayımlanmış cevapla uyuştu mu?
Raw data or primary data, which are collected directly related to their object of study, are the original measured values or scores, without any manipulation, except perhaps sorting in the case of quantitative data.
Cevabın yayımlanmış cevapla uyuştu mu?
Central tendency is defined as “the tendency of data to cluster around some random variable value”.
Cevabın yayımlanmış cevapla uyuştu mu?
The mode is the most frequent value in the entire data.
Cevabın yayımlanmış cevapla uyuştu mu?
The median is the middle value of an ordered dataset.
Cevabın yayımlanmış cevapla uyuştu mu?
There are several purposes for quantifying central tendency measures. The primary purpose of computing them is to determine a single value which may be used to indicate the center of an entire data set including magnitudes of the same data. Another purpose is that since measure of center may represent the whole data, it enables us to make comparisons within or between groups of data. For example, average test performance of students in a class can be compared with the average test performance of students in other classes at the same grade level. Third purpose is that average value can be used in computing some other statistical measures like skewness, kurtosis, and dispersion. More technically, there is an idea that it would be more accurate to calculate different measures of location for different situations, considering the distribution of data.
Cevabın yayımlanmış cevapla uyuştu mu?
The answer is 10 because it is the value that occurs most often than any other observation in the data (it is repeated 4 times).
Cevabın yayımlanmış cevapla uyuştu mu?
SIK SORULAN SORULAR
Bu derste 0 çoktan seçmeli, 3 görselli ve 73 kısa cevaplı soru bulunuyor. Her soru türü en fazla 25 soruluk sayfalara ayrılır.
Çoktan seçmeli ve görselli sorularda bir seçeneği işaretlediğinde doğru cevap gösterilir. Kısa cevaplı sorularda önce cevabını düşün, sonra kaynak cevabı açıp kendini değerlendir. Zorlandığın soruları yeniden çalışabilir, ilerlemeni aynı tarayıcıda sürdürebilirsin.
Hayır. Yılı ve sınav türü doğrulanabilen kayıtlarda bu bilgi soru kartında gösterilir. Arşiv, tüm yılların eksiksiz resmî sınav kitapçığı olarak değerlendirilmemelidir.